On Time Delivery Performance Metrics: The Complete Guide — Routelink
Master on time delivery performance metrics with clear formulas, real benchmarks, and actionable strategies. Optimize your fleet today.

9 October 2026 · Routelink Team
On Time Delivery Performance Metrics: The Complete Guide
Master on time delivery performance metrics with clear formulas, real benchmarks, and actionable strategies. Optimize your fleet today.
A delivery can be marked successful in your system while the customer is already calling to complain. The driver arrived within the recorded window, but the truck came too early for the receiving team. Or the shipment reached the site on time with part of the order missing. Meanwhile, the dashboard shows a healthy on-time percentage and the fuel budget keeps taking the hit from repeat visits.
That’s why on time delivery performance metrics need more than a single headline number. Operators must define the promise, capture the actual outcome, and separate punctuality from completeness, condition, and first-attempt success. The right measurement system doesn’t just score drivers. It shows whether planning, stock, dispatch, routing, address quality, or customer access caused the failure.
Table of Contents
- Why Standard On Time Delivery Metrics Fail
- Key Metrics Every Delivery Operator Should Track
- How to Set Up Your Measurement System
- Benchmarking and Understanding Your Data
- Tailoring Strategies for Different Business Types
- Actionable Steps to Improve Delivery Performance
- Conclusion and Next Steps for Operators
Why Standard On Time Delivery Metrics Fail
A building-materials driver arrives at 9:00, exactly when the system says the delivery is due. The customer still rejects the delivery because the agreed slot was 11:00 to 13:00, when a crew and unloading equipment were available. In another case, a beverage wholesaler receives the delivery at the promised time, but several cases are missing. The route report records both stops as on time.
That result is technically consistent with a narrow definition of punctuality, but operationally misleading. On-time delivery is not one universal measure. McKinsey documents materially different choices around the promise date, measurement unit, early deliveries, and treatment of quantities in its analysis of OTIF definition standards. A company may measure against the requested date, a retailer’s must-arrive-by date, or an internally negotiated schedule. It may count orders, lines, cases, or shipments.

The percentage can hide the promise
A basic on-time rate is:
On-time delivery rate = completed deliveries within the agreed window ÷ eligible completed deliveries × 100
That formula is useful only after the business defines each term. The denominator should state whether failed attempts, rescheduled stops, customer holds, and cancelled orders remain included. The window should state whether early arrivals count, whether there’s a grace period, and whether the clock stops at arrival, unloading, or customer acceptance.
Practical rule: Never publish an OTD percentage without publishing its denominator and delivery-window rules beside it.
OTIF is stricter. A delivery passes only when it arrives within the agreed timing conditions and contains the full quantity ordered. OTD can tell you that the truck arrived punctually. OTIF tells you whether the customer received a complete shipment at the expected time.
A high average can still mean poor service
McKinsey reports that 92% of major retailers and manufacturers considered developing an industry OTIF standard valuable, which reflects the commercial cost of inconsistent definitions. The same issue affects local fleets. A single network average can conceal a depot with repeated late stops, a zone with bad addresses, or a customer group that routinely needs a second visit.
The useful question isn’t “What’s our OTD?” It’s “On time against what, for whom, and with what outcome?” Once that question is answered, the metric becomes a management tool instead of a decorative dashboard figure.
Key Metrics Every Delivery Operator Should Track
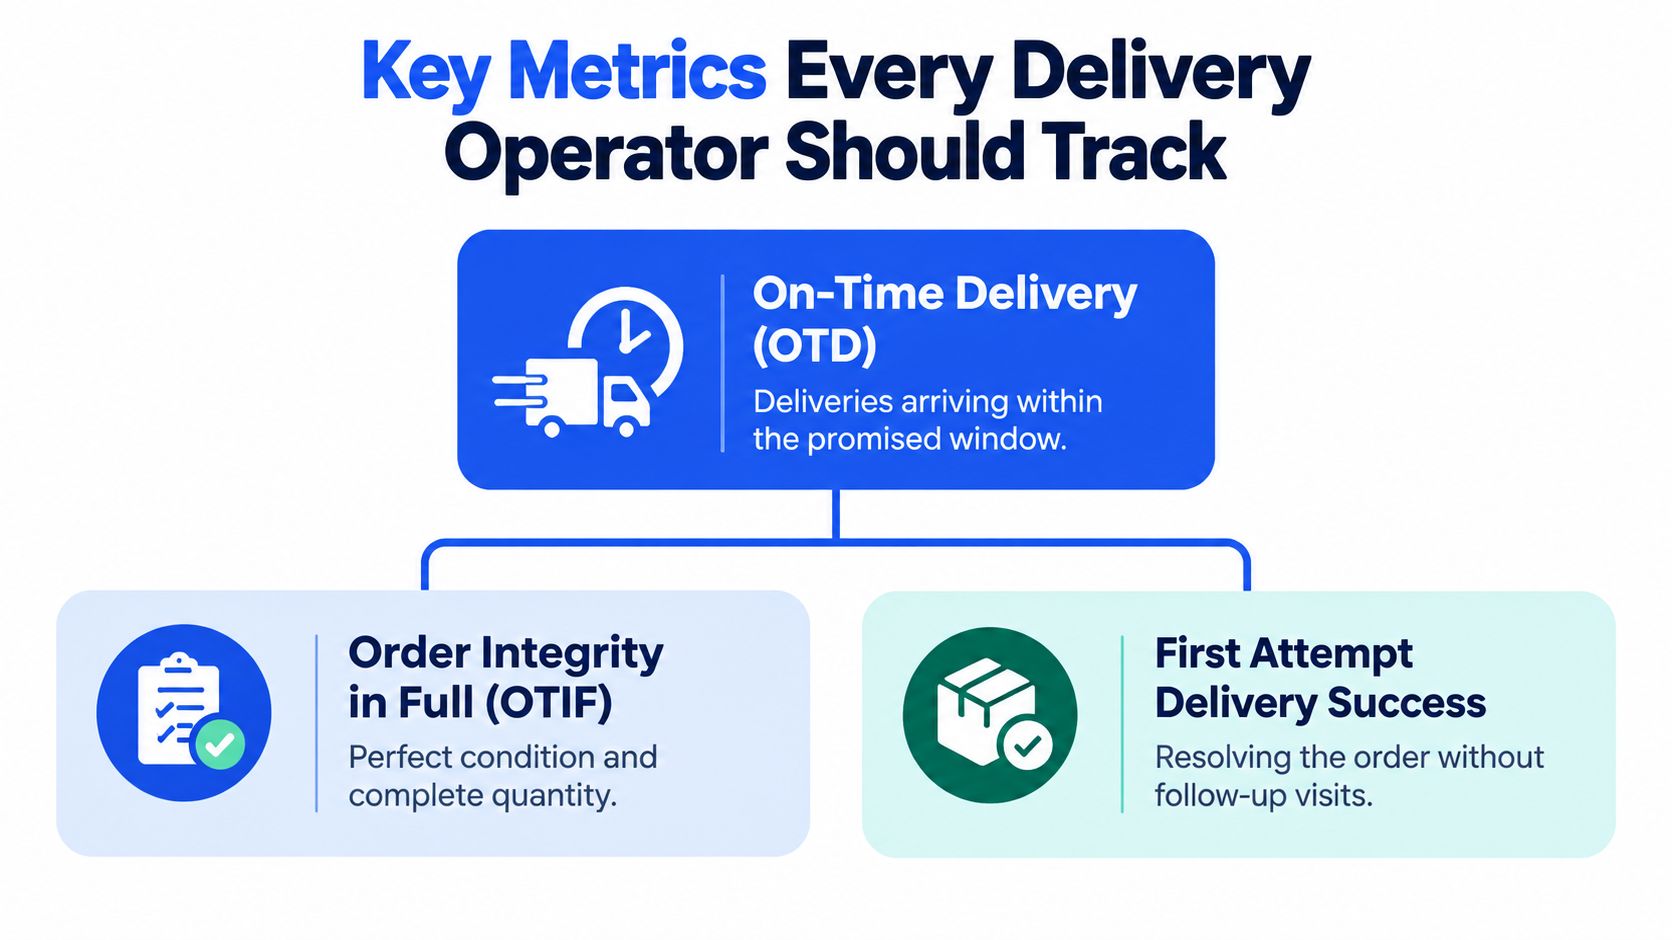
Operators need a small group of related measures rather than one overloaded KPI. Each metric answers a different operational question: Did the delivery arrive within the promise? Was the order complete? Did the first attempt work? How far did the operation drift from plan?
Start with punctuality, then add service quality
On-Time Delivery, or OTD, measures whether the delivery arrived within the agreed window.
OTD = deliveries within the promised window ÷ eligible completed deliveries × 100
Store the promised start and end time, actual arrival timestamp, and any defined grace period. Don’t replace the original promise with a later revised appointment if you want to understand promise reliability.
On-Time In-Full, or OTIF, adds completeness to punctuality.
OTIF = deliveries on time and complete ÷ eligible completed deliveries × 100
A shipment that arrives on time with missing units fails OTIF. For chilled food, LPG, or building supplies, this distinction matters because a partial delivery may leave the customer unable to use the shipment.
First-attempt delivery success measures whether the stop was resolved without a follow-up visit.
First-attempt success = deliveries completed on the first attempt ÷ delivery attempts × 100
Record the reason when the first attempt fails. “Customer unavailable,” “address issue,” “vehicle problem,” and “stock short” point to different corrective actions.
Measure the size and source of failure
Late variance shows how many minutes a stop missed the promise by. A percentage treats a five-minute delay and a half-day failure as equivalent, so managers need the underlying minutes as well.
Early variance deserves its own field. Early delivery may be acceptable for one customer and disruptive for another, particularly where receiving capacity or appointment slots are limited.
ETA accuracy compares the predicted arrival with the actual arrival. It’s valuable for customer communication and dispatch decisions, but it shouldn’t replace final OTD. A useful ETA can still end in a late delivery.
Dwell time measures time spent at the stop, from arrival through departure. Long dwell may indicate unloading constraints, paperwork, customer preparation, or an inaccurate service-time assumption.
For a broader reference point on operational measurement, B2B operational efficiency metrics can help teams connect delivery outcomes with wider process indicators. The important discipline is to keep each metric separate enough that a manager can identify what failed, rather than blending every outcome into one composite score.
How to Set Up Your Measurement System
Accurate reporting starts before the vehicle leaves the depot. If the system stores only a planned date and a completion tick, it can’t explain whether the driver arrived early, waited for access, delivered incomplete goods, or failed because the address was wrong.
Build the event record first
Capture these fields for every eligible stop:
- Promise details: Store the original requested date, confirmed promised date, delivery window, service type, and any agreed tolerance.
- Actual events: Record dispatch, arrival, service start, departure, completion, and reschedule timestamps.
- Location evidence: Use geolocation, geofences, or a verified customer pin to distinguish arrival at the destination from a driver marking a stop complete elsewhere.
- Order outcome: Record quantity delivered, condition issues, missing items, rejected goods, and proof-of-delivery status.
- Exception reason: Require a structured reason for late or failed work, with notes for unusual circumstances.
Don’t allow a revised appointment to overwrite the original promise. Keep both values. The revised date may help assess execution against the latest commitment, while the original date reveals whether the business promised something it couldn’t reliably deliver.
Connect the data to the operating routine
Your planning system, driver workflow, customer notifications, and reporting layer should use the same stop identifier. That prevents a completed route from becoming an untraceable spreadsheet row and makes it possible to inspect the exact address, route, driver, and exception behind a result.
A platform such as Routelink can combine order intake, geocoding, route planning, driver browser links, customer notifications, proof of delivery, and post-run analytics. For background on the operational layer, see delivery tracking software for local fleets.
Start with a daily exception view. Show late stops, failed first attempts, missing proof of delivery, address corrections, and overloaded routes. Then review the weekly pattern by depot, zone, route, driver, customer type, and time slot. This cadence turns measurement into action without forcing managers to inspect every completed stop manually.
Benchmarking and Understanding Your Data
Benchmarks are useful for context, but they can also create false confidence. A network average tells you where the operation sits overall. It doesn’t tell you whether one depot is carrying the failures or whether a relaxed service-standard measure is hiding missed promised windows.
USPS quarterly Package Services data illustrates the point. In fiscal-year 2024 Quarter 2, covering January 1 through March 31, national performance was 94.3% on time, down 0.6 percentage points from the same period a year earlier. 49 of 50 districts met or exceeded the 90.0% target. In Quarter 3, national performance rose to 95.3%, with 49 districts again reaching at least 90.0%. By Quarter 4, performance reached 96.8%, up 0.8 percentage points year over year, and all 50 districts met or exceeded the target, according to the USPS fiscal-year 2024 Package Services report.
Compare like with like
USPS also reported a broader measure for packages delivered within the service standard plus three days. That result was 98.0% in Quarter 2, 98.4% in Quarter 3, and 99.5% in Quarter 4. Those figures shouldn’t be substituted for exact promised-window performance. They demonstrate why a dashboard should show strict compliance separately from a relaxed tolerance measure.
| View | What it tells you |
|---|---|
| Promised-window OTD | Whether the operation kept the defined customer promise |
| Within-tolerance result | How many deliveries arrived inside a broader service allowance |
| Depot or district result | Where failures are concentrated |
| Late minutes | How severe the delay was |
| First-attempt success | Whether the stop was resolved without repeat work |
A one-point movement in a network average can hide a serious local problem. Break results down by depot, territory, route, driver, service type, time slot, and exception reason. That’s where managers find overloaded runs, weak geocoding, unrealistic appointment windows, and customer-access patterns.
Use analytics to find the operational story
Good data analytics for user insights starts with reliable event data and ends with a decision. For delivery operations, the decision might be to add capacity to one zone, change a receiving window, validate addresses earlier, or stop promising a slot that the route cannot support.
Route design is part of the measurement story, not a separate concern. A route can fail because of poor sequencing, excessive capacity, or a depot assignment that creates unnecessary travel. Teams assessing route optimization for last-mile delivery should compare planned versus actual arrival, distance, dwell, and exception outcomes rather than judging a route only by miles.
Tailoring Strategies for Different Business Types
The right delivery promise depends on the product, customer, vehicle, and receiving process. A food-service customer may need a narrow appointment slot because staff and cold storage are ready for a specific handoff. A B2B distributor may accept a date or half-day window. A furniture customer may care as much about room-of-choice service and first-attempt access as the exact arrival minute.

Match the metric to the operating model
Small and midsize retailers usually need simple, visible controls. Their biggest risks are missed customer availability, weak addresses, and dispatch changes made through calls or messages. OTD, first-attempt success, ETA accuracy, and proof-of-delivery exceptions provide a practical starting set.
Heavy-goods operators need capacity and service-time discipline. Building materials, aggregates, firewood, and appliances can’t be managed like parcels because vehicle capacity, unloading requirements, access restrictions, and handling time shape the route. Track volume or weight against route capacity, dwell time, failed access, and damage or condition exceptions alongside punctuality.
Perishable-goods providers need tighter timing and stronger condition controls. A chilled-food wholesaler may define “on time” by an hourly appointment, while the customer also needs the order complete and usable. OTIF alone may still be insufficient if temperature or product condition determines acceptance, so proof-of-delivery exceptions should remain visible.
LPG and bottled-gas distributors have a different risk profile again. A failed attempt may create a safety, availability, or urgent service issue, while an address or access error can send a vehicle back through the same territory. First-attempt success and exception reason should sit beside OTD, not in a separate report that nobody reviews.
Don’t borrow a benchmark without borrowing the conditions
A narrow appointment window can make OTD harder than a broad date promise, but that doesn’t mean the broader promise creates better service. It may just make the score easier to achieve. Define windows around real customer availability, vehicle capability, and unloading requirements, then compare like-for-like service types.
Operational teams can use different thresholds internally while preserving one clear customer-facing promise. For example, dispatch may monitor early risk, late minutes, and ETA drift before the final window closes, while leadership reviews promised-window OTD and first-attempt success after the run.
A short visual explanation can help align office staff, dispatchers, and drivers on the difference between punctuality, completeness, and successful completion.
The strongest model is usually not the strictest headline target. It’s the model that reflects what customers experience and gives managers enough detail to correct the cause.
Actionable Steps to Improve Delivery Performance
Improvement starts with the failures that consume the most time and fuel, not with a more aggressive target on the dashboard. A route that repeatedly arrives late because it carries too much volume needs a capacity decision. A route that fails because customers aren’t available needs communication and appointment control.
Fix the planning causes before coaching the driver
Review late and failed stops by route, zone, depot, time slot, load, address quality, and exception reason. Separate controllable lateness from upstream stock shortages, customer holds, access restrictions, and unrealistic promises. A driver can’t recover a route that was overloaded before dispatch.
Then act on the dominant pattern:
- Capacity overload: Move stops, split the run, change depot assignment, or adjust the promised window.
- Address failure: Validate the address at intake, flag weak geocodes, and confirm the customer pin before planning.
- Customer unavailable: Send a useful ETA, offer a clearer delivery window, and record access instructions.
- Poor sequencing: Rebuild the route using service time, vehicle limits, zones, and appointment constraints.
- Incomplete order: Stop counting punctuality as success when the customer can’t use the shipment.
Tools such as Routelink can support route planning, multi-depot dispatch, capacity visibility, browser-based driver updates, customer notifications, and proof of delivery. The value comes from connecting those actions to the exception review, not from adding another screen to the operation.
Use leading signals during the run
Managers should watch ETA drift, remaining capacity, uncompleted stops, dwell time, and failed contact attempts while routes are active. A late stop identified before the promised window closes still has recovery options. A late stop discovered the next morning only creates an explanation.
For a complementary view of bottleneck diagnosis, OrderOut on measuring delivery bottlenecks provides useful context for tracing where delivery work slows down. Keep the review focused. Choose a small number of recurring causes, assign an owner, and check whether the next run produced a different outcome.
For a practical reference on keeping deliveries on schedule, see delivery on schedule planning. Better performance usually comes from repeated operational corrections, not one dramatic software change.
Conclusion and Next Steps for Operators
The useful version of on-time delivery is specific. It states which promise applies, which timestamp counts, how early arrivals are treated, what belongs in the denominator, and whether completeness or condition is part of success.
Track OTD for punctuality, OTIF for timing plus completeness, first-attempt success for avoidable repeat work, and late or early variance for severity. Then cut the results by depot, zone, route, driver, service type, time slot, and exception reason. Those views show whether the problem sits in planning, inventory, address quality, capacity, customer access, or execution.
USPS performance data shows why exact-window results and broader tolerance results should remain separate. A relaxed measure can look strong while the actual customer promise is still being missed. Your own dashboard should make that distinction just as clear.
Start with an audit of the last completed delivery period. Check whether every stop has the original promise, actual arrival, completion status, quantity outcome, proof of delivery, and exception reason. Add one missing metric this week, review it with dispatch and drivers, and use the first recurring pattern to change a route, window, capacity rule, or customer communication process.
Routelink brings order intake, route optimization, driver dispatch, customer notifications, live tracking, proof of delivery, and post-run analytics into one web-based workflow. Visit Routelink to evaluate whether it can help your team measure promised-window performance, first-attempt completion, and late-stop causes with less manual work.