Benchmarking in Industry: A Practical Guide for Operations — Routelink
Learn how benchmarking in industry drives measurable gains in local delivery, from KPI definitions to peer comparisons and continuous improvement workflows.
16 October 2026 · Routelink Team
Benchmarking in Industry: A Practical Guide for Operations
Learn how benchmarking in industry drives measurable gains in local delivery, from KPI definitions to peer comparisons and continuous improvement workflows.
You can feel it in the day-to-day. Two depots run the same product mix, leave at the same time, and hit roughly the same number of stops, yet one board clears an hour earlier, burns less fuel, and needs fewer customer callbacks. The first reaction is usually to praise the stronger team or blame the weaker one, but that’s not benchmarking in industry, that’s guesswork with a spreadsheet.
Real benchmarking asks a harder question, what exactly is different, and what part of the process created the gap? In local delivery, that question matters because a route can look efficient on paper while hiding bad addresses, poor zone design, weak loading practice, or too much waiting at the customer site. If the comparison can’t survive that level of scrutiny, it isn’t useful.
Table of Contents
- Why Two Routes That Look Identical Can Perform Differently
- What Industry Benchmarking Really Means
- The Core KPIs Every Delivery Operation Should Track
- Four Benchmarking Methods and When Each One Works
- Building a Benchmarking Workflow You Can Repeat
- How the Same KPI Behaves Across Retail, Perishables, and Heavy Goods
- Why Your Data Has to Be Ready Before You Benchmark Anything
- Turning Benchmark Insights Into Daily Operating Decisions
Why Two Routes That Look Identical Can Perform Differently
A manager once showed me two route sheets that looked almost identical at first glance. Same depot, similar mileage, same stop count, same driver start time. One route finished cleanly. The other was still open when the office was already handling late-order calls.
The difference wasn’t obvious from the headline numbers. One route spent more time waiting on site, had more address corrections before dispatch, and carried more awkwardly sized drops that slowed unloading. The route looked like a peer until you broke it into components.
Context changes what the numbers mean
That’s the first lesson in benchmarking in industry, especially in operations. A number by itself rarely tells you whether a team is good, unlucky, or just working a harder mix of jobs. The Xerox story shows why this matters. In 1979, Xerox formalized benchmarking under severe pressure from Japanese copier makers, then moved from product comparison to studying competitor processes, costs, quality practices, and logistics. By 1981, it had become standard operating procedure, and the practice later spread well beyond manufacturing. Xerox’s benchmarking history is a reminder that the point was never just to rank scores, it was to understand how work gets done.
Practical rule: if two routes are not normalized for density, geography, service windows, and fleet type, they’re not really being compared.
That’s why anecdotal comparison breaks down fast. A dispatcher may say one driver is “faster,” when the true difference is that one route serves compact urban drops and the other crosses sparse territory. If you want a comparison you can act on, you need a controlled measurement system, not a leaderboard.
The cleanest definition is simple. Benchmarking is the repeatable practice of measuring performance, comparing it with a relevant reference point, identifying a better practice, adapting it, and then checking whether the change held. That cycle matters more than the number itself.
What Industry Benchmarking Really Means
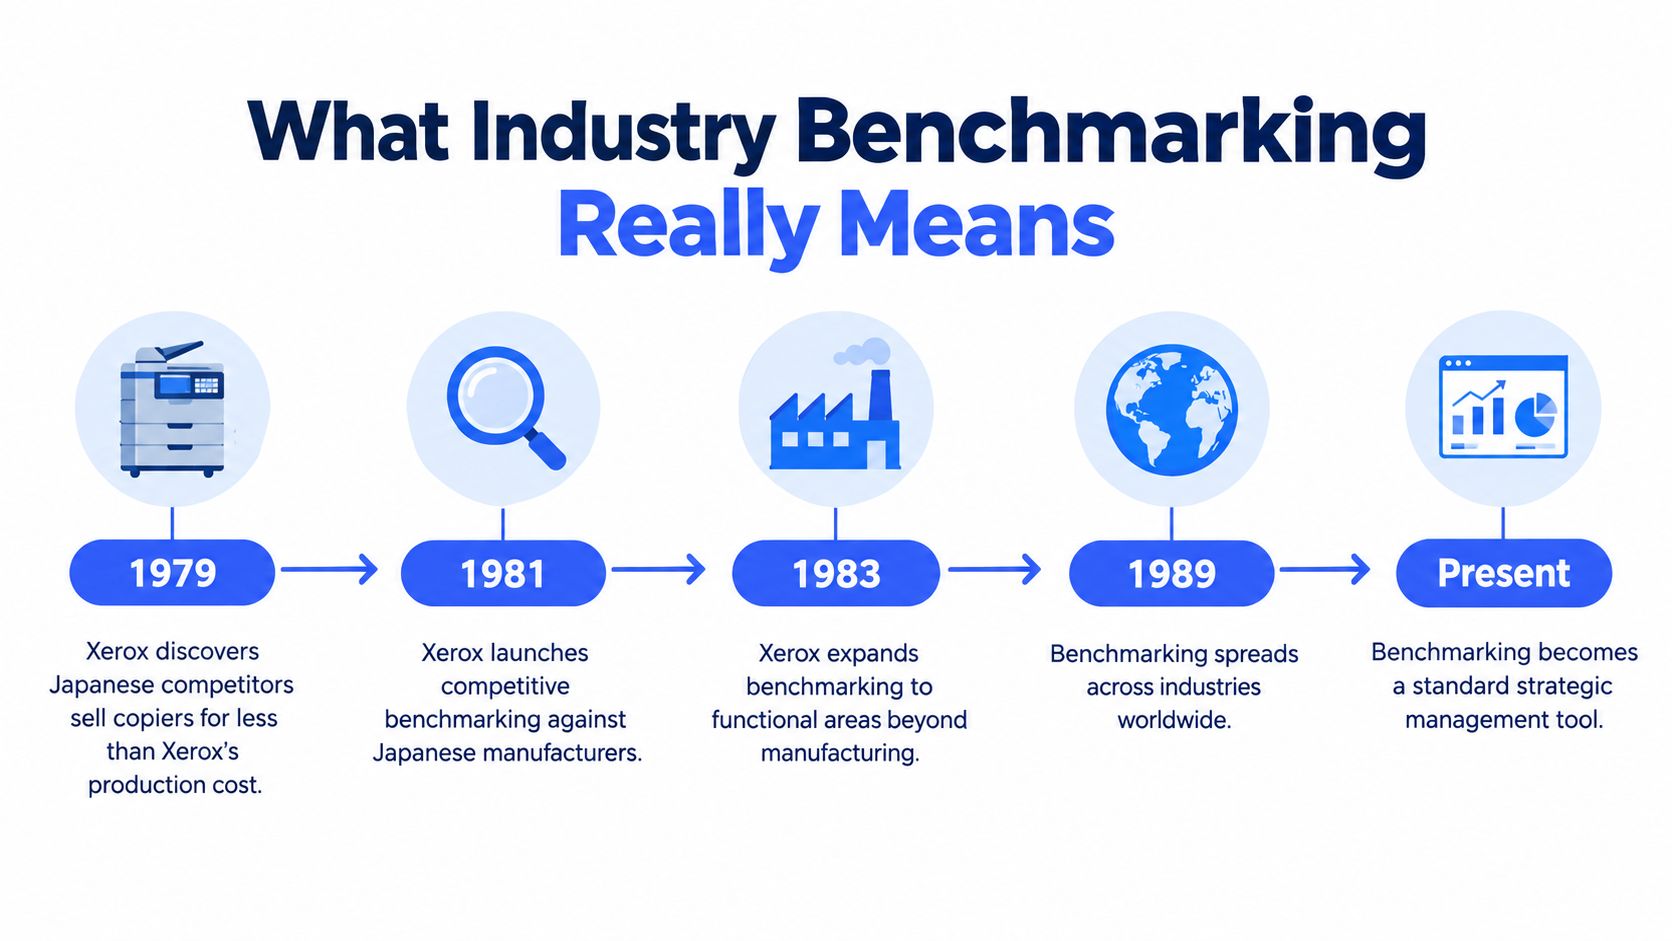
Benchmarking is not the same thing as a KPI dashboard, and it’s not the same thing as competitive analysis. A KPI dashboard tells you what happened in your own operation. Competitive analysis tells you how rivals are positioned. Benchmarking asks what process, practice, or operating rule produces a better result, then uses that insight to change your own system.
From product comparison to process learning
The Xerox timeline is useful because it shows the shift clearly. The company started by comparing against lower-cost competitors, then expanded into studying whole processes, including quality and logistics, and later treated benchmarking as a repeatable management system rather than a one-off exercise. By 1989, that discipline was tied closely to institutional quality management, including Xerox’s Malcolm Baldrige National Quality Award milestone, which helped normalize benchmarking inside large organizations. Xerox’s historical benchmark development shows that the power of the method is in the cycle, not the snapshot.
Think of benchmarking as the operating manual of an industry, not its trophy cabinet. A trophy cabinet says who won. An operating manual shows how the work is done, what gets measured, and where the handoffs fail.
For operations teams, that distinction matters. A driver can hit the target on one day because demand was light. A benchmark, on the other hand, has to hold up across comparable conditions, and it has to point to a process you can reproduce. That is why organizations often move from simple competitor comparison to functional or best-in-class benchmarking, where the better process might come from another sector entirely.
If you need a parallel outside delivery, the healthcare sector often uses top performer benchmarks in healthcare to compare service flow, reliability, and resource use in a way that is more operational than promotional. The industry is different, the logic is the same. Better process beats prettier numbers. top performer benchmarks in healthcare is a useful example of that mindset.
The most useful benchmark may come from outside your sector if the underlying process is better. That principle has stayed consistent since Xerox made benchmarking an executive-level practice instead of a quality side project.
The Core KPIs Every Delivery Operation Should Track
The easiest mistake in delivery benchmarking is collecting too many metrics and learning too little. If the KPI doesn’t help you decide whether to rezone, re-dispatch, add headroom, or change loading practice, it’s decoration. Start with a small set that explains the route, not just describes it.
| KPI | Formula | What It Reveals |
|---|---|---|
| On-time rate | On-time deliveries ÷ total deliveries | Service reliability against promise windows |
| Cost per stop | Total route cost ÷ completed stops | Efficiency of the route, but not route difficulty |
| Fuel per mile | Fuel consumed ÷ miles driven | Driving efficiency and likely routing waste |
| Vehicle utilization | Loaded volume, weight, or work used ÷ available capacity | How much of the fleet’s capacity is actually used |
| Dwell time | Time on site minus driving time | Whether delays come from the customer, the driver, or the stop design |
What each KPI says, and what it hides
On-time rate is useful because it tells you whether the customer got what was promised. It hides the reason the promise was missed. A route can have a weak on-time rate because of bad sequencing, unrealistic service windows, congestion, or repeated failed handoffs. If you want the fuller picture, pair on-time data with route readiness and exception logs. The article on on-time delivery performance metrics goes deeper into that distinction.
Cost per stop sounds clean, but it can reward the wrong thing if the stop mix changes. A dense urban drop and a remote pallet delivery should not be judged as if they were the same unit of work. Use the metric to ask whether the route design is efficient, not whether the driver “costs too much.”
Fuel per mile is often the quickest signal of avoidable waste. It can point to idling, poor route shape, excess repositioning, or vehicles that are not well matched to the load. It does not, by itself, tell you whether the miles were necessary in the first place.
Vehicle utilization needs the most care. A truck that looks underused on capacity can still be the right vehicle for a difficult service area, a mixed-load day, or a route with long dwell times. If you don’t split utilization by weight, volume, and time, you’ll end up praising empty trucks and punishing routes that were constrained for a reason.
Dwell time is the most diagnostic KPI on the list if you break it properly. Separate customer waiting, access delays, unloading time, and driver-side time spent searching, parking, or correcting information. Otherwise you’ll blame the wrong part of the process.
The rule I use is blunt, if a KPI doesn’t change a route plan, a staffing call, or a service rule, it doesn’t belong on the board.
Four Benchmarking Methods and When Each One Works
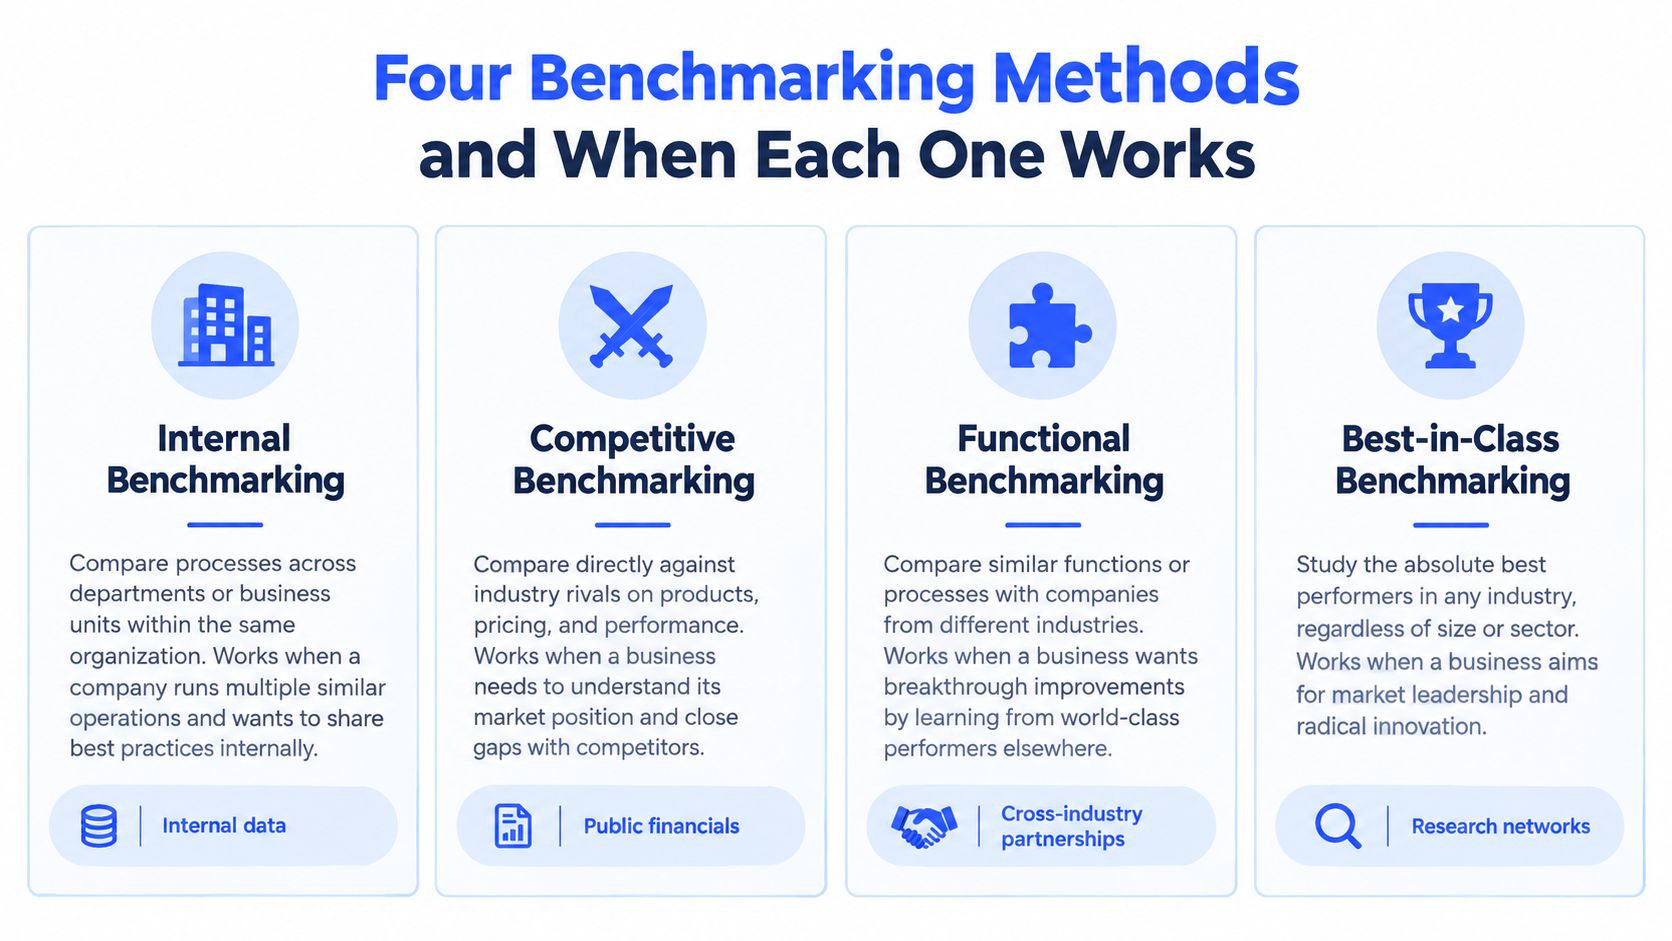
Benchmarking methods are not interchangeable. Pick the wrong one and you’ll spend weeks looking for data that doesn’t exist. Pick the right one and the work gets clearer fast.
A quick decision guide
| Method | Best use | What you need |
|---|---|---|
| Internal benchmarking | Multiple depots, fleets, or shifts inside one business | Clean internal data with comparable definitions |
| Competitive benchmarking | You need to understand direct market position | Comparable external data, usually limited and imperfect |
| Functional benchmarking | You want a better process, even from another industry | Process-level access, not just headline numbers |
| Best-in-class benchmarking | You want the strongest reference point available | Broader research networks and careful normalization |
Internal benchmarking works best when the same company runs several similar operations. It’s the easiest place to start because the data is usually more accessible, and differences are more likely to come from process variation than from radically different business models.
Competitive benchmarking is narrower. It helps when you need to compare against direct rivals, but comparable definitions are hard to get. If the metric isn’t defined the same way on both sides, the comparison doesn’t hold up.
Functional benchmarking is usually where the better ideas come from. A delivery team may learn more from a warehouse picking process, a healthcare intake flow, or a service dispatch model than from a rival carrier’s glossy summary. That’s where the earlier healthcare resource fits naturally, because the principle is about process quality, not sector identity.
Best-in-class benchmarking sets the bar using the strongest performer available, regardless of industry. It’s ambitious, but it only works if the underlying activity really is comparable. The target should be a process that can be adapted, not copied blindly.
For teams comparing route tools, it can help to look at a practical comparison resource like check Aeros Couriers’ courier picks as a way to see how service features and operating assumptions get presented to users. That kind of comparison is more useful when you know what your own metrics mean.
If route design is part of the problem, a planning layer matters too, which is why the internal discussion around route optimization for last-mile delivery belongs alongside benchmarking, not after it.
The methods overlap. A single project may start with internal benchmarking, borrow a functional idea, and end with a best-in-class target.
Building a Benchmarking Workflow You Can Repeat
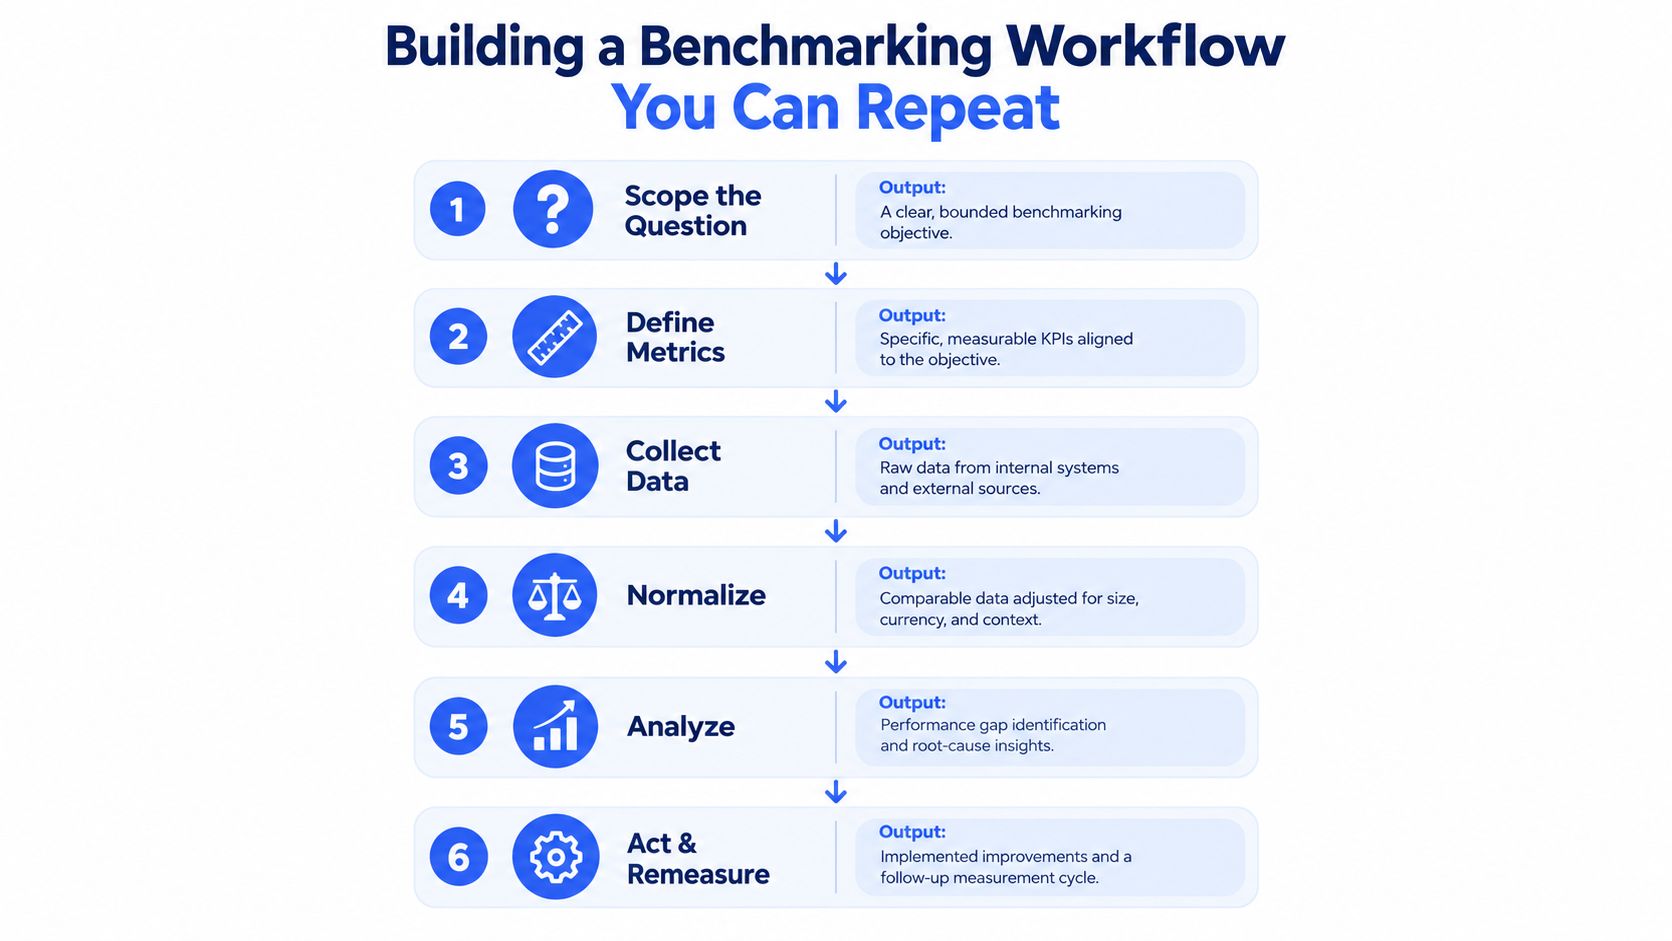
A benchmarking project fails most often because teams jump straight to the comparison and skip the plumbing. The workflow has to be boring on purpose. That’s what makes the result defensible.
Scope, define, and collect
Start with one question. For example, are certain depots finishing routes later because of stop density, loading delays, or route structure? A tight question keeps the benchmark from expanding into a vague performance audit.
Next, define the metric with explicit numerators, denominators, scope, and time windows. ISO/IEC 29155-1 frames benchmarking as a structured system with defined measures and repeatable collection, which is exactly what operational teams need when they compare routes, depots, or time periods. ISO/IEC 29155-1 benchmarking framework is a solid reference for that discipline.
Then collect the data from internal systems and, if needed, from external reference points. The most common failure here is mixed definitions. A “stop” in one system is not always the same as a “stop” in another.
Normalize, analyze, act, and remeasure
Normalization is where weak projects become honest. Adjust for geography, service window, fleet type, density, and any other factor that changes the work. Without that step, a dense city route will almost always look better than a sparse rural one.
Analysis should separate the gap into causes. Is the problem planning, dispatch, execution, or customer availability? That distinction matters because each cause has a different fix.
Measure a baseline, make one change, then measure again under comparable conditions. Otherwise seasonal noise gets credit for your improvement.
The last two steps are action and remeasurement. You change the workflow, route template, capacity rule, or notification process, then compare again. That is how benchmarking becomes a control loop instead of a report.
A practical platform such as Routelink can support this workflow through intake, multi-depot planning, customer notifications, and post-run analytics. The point isn’t the tool itself. The point is to make each phase part of daily operating work, not an annual review.
How the Same KPI Behaves Across Retail, Perishables, and Heavy Goods
A KPI only makes sense when you know what kind of work it is measuring. Retail D2C, perishables, and heavy goods all use the same language, but the operational reality is different enough that one benchmark can mislead another.
Retail D2C
For retail direct-to-consumer delivery, on-time rate usually matters more than squeezing a few cents out of cost per stop. A delayed parcel can create a customer service ticket, a failed repeat order, or a missed re-delivery slot. In that world, the route that looks slightly more expensive may still be the better business choice if it protects the delivery promise.
The trap is assuming that every late stop means bad route planning. Sometimes the issue is weak order cutoff discipline, poor address quality, or too many promised windows on one run. The benchmark needs to reveal that, not hide it.
Food and perishables
Perishable delivery changes the meaning of dwell time. A truck may be “on site” but still exposed to a temperature-sensitive service window, which means waiting is not neutral. Here, cost per stop can hide spoilage risk, repeat handling, and the extra effort required to meet tight timing expectations.
The right comparison is often between routes with similar product types, customer readiness, and access conditions. If a bakery route and a chilled-goods route are scored the same way without segmentation, the benchmark will tell a false story.
Heavy goods
Heavy goods work changes utilization. A truck can be weight-constrained before it is volume-constrained, or the reverse. If you only watch one capacity measure, you can end up calling a half-full truck inefficient when it was close to its practical limit on weight, handling time, or load sequence.
That’s why utilization should be read as a diagnostic range, not a universal standard. Context matters, and the work itself determines what “good” looks like.
Why Your Data Has to Be Ready Before You Benchmark Anything
The common mistake is to begin with peer averages. The better move is to ask whether your own measurement is reliable enough to compare at all. If the inputs are messy, the benchmark will reward record-keeping discipline more than actual performance.
A 2025 benchmarking review found that 42% of respondents identified data quality and consistency as their biggest challenge, and smaller businesses were described as having less consistent processes and weaker benchmarking infrastructure, which is exactly the problem most delivery teams run into when records come from multiple systems. Benchmarking best practices in manufacturing and consumer logistics makes the challenge plain. The issue is not a lack of KPIs. It’s measurement hygiene.
A readiness checklist that actually helps
- Minimum fields: confirm that stop, route, depot, date, driver, and outcome are always present.
- Validation rules: set checks for impossible times, duplicate stops, and missing geocodes.
- Geocoding confidence: flag addresses that need manual correction before they enter a benchmark set.
- Exception thresholds: define what counts as a failed delivery, a late arrival, and a completed stop.
- Completeness score: track missing data alongside fuel, mileage, and on-time figures.
Spreadsheet imports, ecommerce orders, ERP feeds, and manual entries create structurally different datasets. If you don’t reconcile them first, any comparison can be wrong in a very confident way.
For route cost baselines, the internal guide on how to calculate cost per mile is a useful companion because it forces the same discipline on cost categories that benchmarking needs on every other metric.
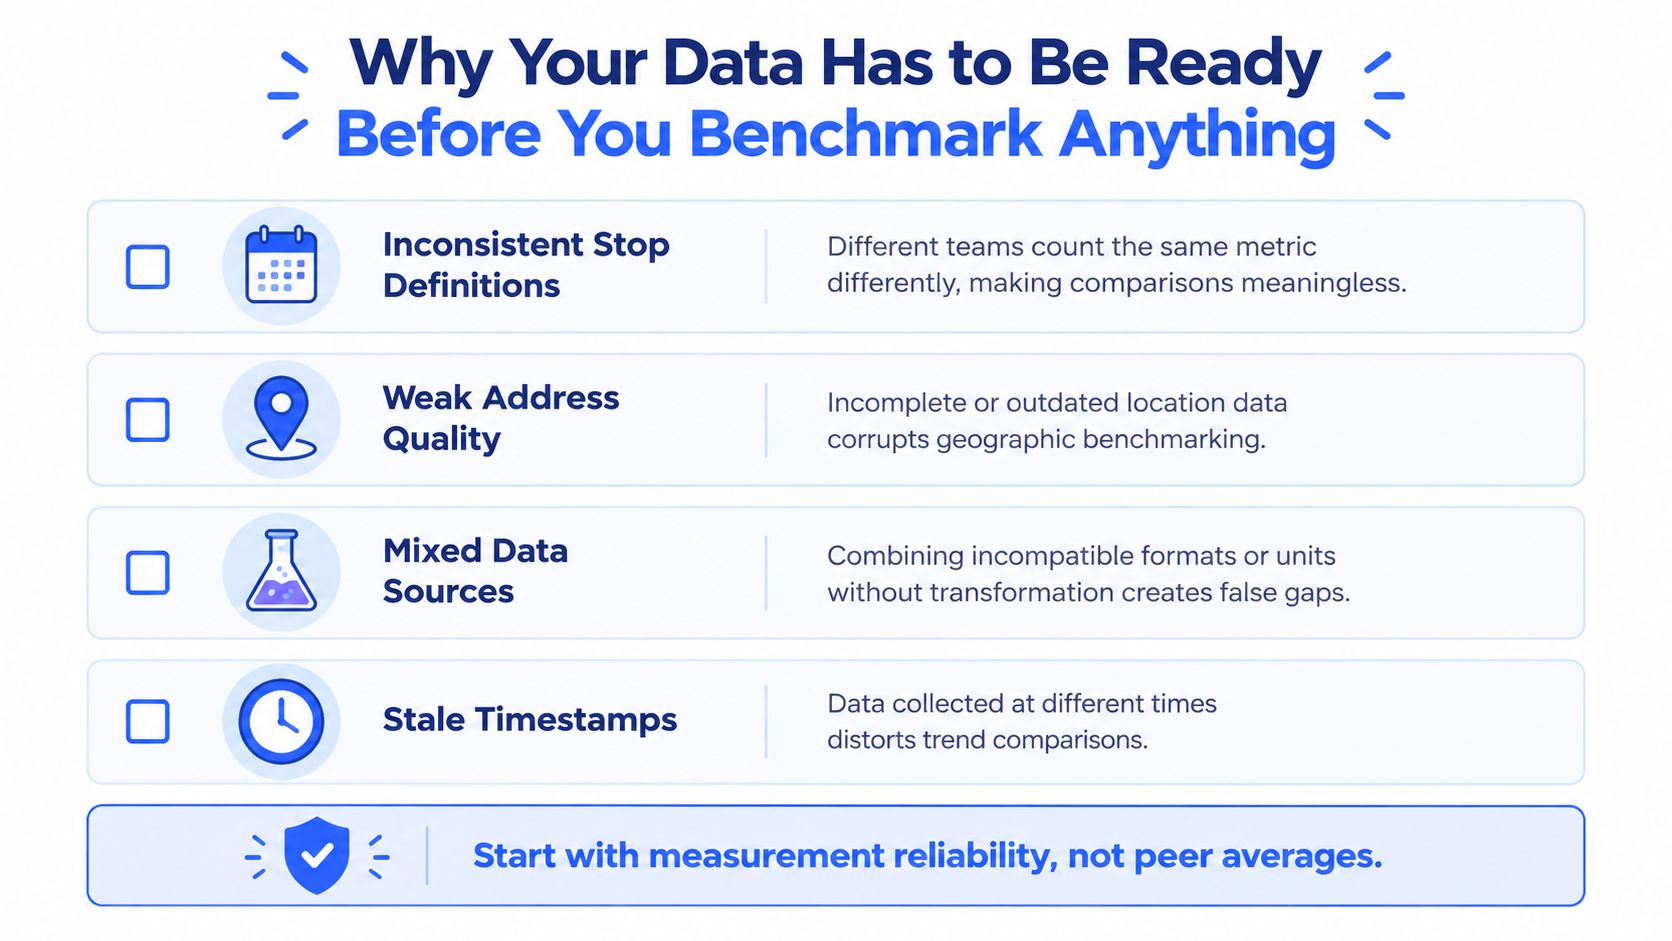
Start with measurement reliability, not peer averages.
Turning Benchmark Insights Into Daily Operating Decisions
Benchmarking only pays off when the result changes daily behavior. If the insight never reaches routing, dispatch, or customer communication, it stays interesting and useless.
Map the insight to a lever
A route benchmark should point to a decision. If the gap comes from stop density, then the lever may be zone configuration or route templates. If the gap comes from late departures, then the fix may be loading sequence, staffing, or tighter dispatch cutoffs. If the gap comes from failed handoffs, then customer notifications and proof-of-delivery practice need a closer look.
Leading indicators matter here because they let you intervene early. Track geocoding success, route completion readiness, and capacity headroom before the truck leaves. Then track lagging outcomes like miles, cost, on-time rate, and completion rate after the run. Used together, those measures turn benchmarking into an operating-control loop.
Make the board part of the process
The biggest shift I’ve seen across depots is when benchmarking stops living in a separate spreadsheet. Once the metrics sit next to intake, route planning, and post-run review, the team starts using them in real time. That’s where a system like Routelink can fit naturally, because it ties order intake, multi-depot planning, notifications, and post-run analytics into one operating flow.
A practical quarterly plan is enough to get moving:
- Define two KPIs with explicit formulas. Pick one service metric and one efficiency metric.
- Run the readiness checklist. Clean the fields before you compare any route.
- Connect the metrics to the route-planning board. Keep them close to the decisions they should influence.
That’s the difference between a benchmark and a vanity report. One changes the next route. The other just fills a slide.
If you’re trying to make benchmarking useful in a delivery operation, Routelink gives you the intake, planning, notifications, and post-run analytics to keep the comparison tied to real routes. Visit Routelink to see how it supports multi-depot planning and day-to-day measurement without forcing your team into disconnected spreadsheets.